


Score Processing
Test scores from DELTA administrations are exported from the DELTA system and imported into Winsteps for analysis. Analysis first starts with the analysis of test items followed by the generation of individual student profiles.
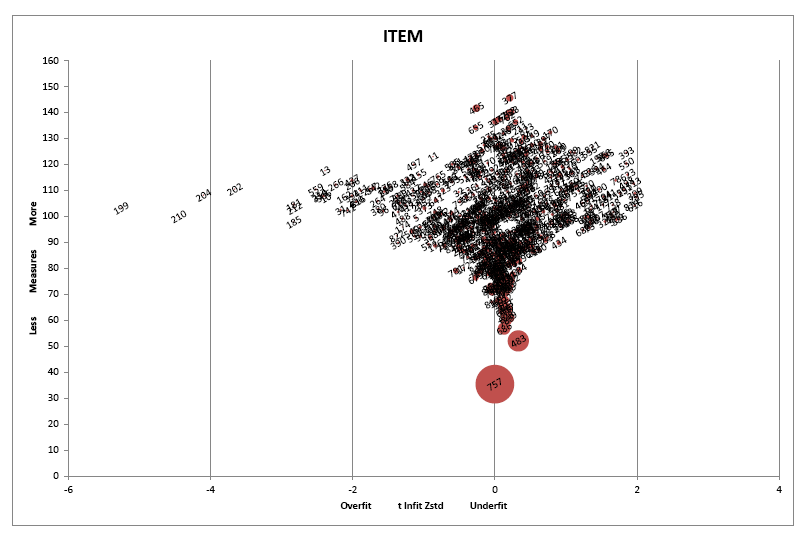
Analysis of test items involves two steps: calibration and validation. Calibration of items begins with an investigation of the fit statistics of each item (Smith, 2004; Stone, 2004). Winsteps bubble charts (Figure 1) illustrate the degree of fit (over or under) against item measure. Misfitting items are eliminated and the analysis is re-run until the items satisfactorily fit the Rasch model (Figure 2) and result reports can be generated.
Item diagnosis is also performed as part of the item calibration process. Each component of the test is divided into testlets and items within testlets that do not fit the Rasch model are flagged for further inspection. Expert judgment is conducted on these items to investigate the quality of these items (i.e. revision of items or deletion from the item bank). Testlets that do not fit the Rasch model are excluded from analysis to prevent inaccurate and imprecise measurement of student abilities.
Test scores from DELTA administrations are exported from the DELTA system and imported into Winsteps for analysis. Analysis first starts with the analysis of test items followed by the generation of individual student profiles.
Analysis of test items involves two steps: calibration and validation. Calibration of items begins with an investigation of the fit statistics of each item (Smith, 2004; Stone, 2004). Winsteps bubble charts (Figure 1) illustrate the degree of fit (over or under) against item measure. Misfitting items are eliminated and the analysis is re-run until the items satisfactorily fit the Rasch model (Figure 2) and result reports can be generated.
Item diagnosis is also performed as part of the item calibration process. Each component of the test is divided into testlets and items within testlets that do not fit the Rasch model are flagged for further inspection. Expert judgment is conducted on these items to investigate the quality of these items (i.e. revision of items or deletion from the item bank). Testlets that do not fit the Rasch model are excluded from analysis to prevent inaccurate and imprecise measurement of student abilities.
Score Reporting
Winsteps also generates measures of students’ abilities. These results are imported into the DELTA system to generate individual student profiles. Students will receive an email notification when their reports are ready for viewing and printing.
Analysis of test items involves two steps: calibration and validation. Calibration of items begins with an investigation of the fit statistics of each item (Smith, 2004; Stone, 2004). Winsteps bubble charts (Figure 1) illustrate the degree of fit (over or under) against item measure. Misfitting items are eliminated and the analysis is re-run until the items satisfactorily fit the Rasch model (Figure 2) and result reports can be generated.
Score Interpretation
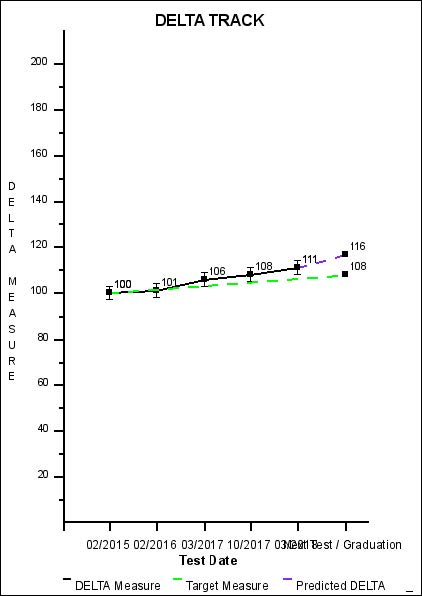
The DELTA Track shows students’ English proficiency calculated from their performance on the DELTA tests. Each time a student takes the test, their Delta Measure is plotted to show progress.
The DELTA Track shows students’ English proficiency calculated from their performance on the DELTA tests. Each time a student takes the test, their Delta Measure is plotted to show progress.
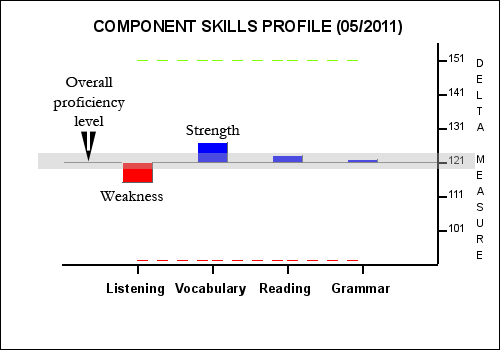
The Component Skills Profile shows the contribution that the scores that a student attained on each component to their overall DELTA Measure. Components below their overall proficiency level (see line in the middle of chart) indicate areas of relative weakness.
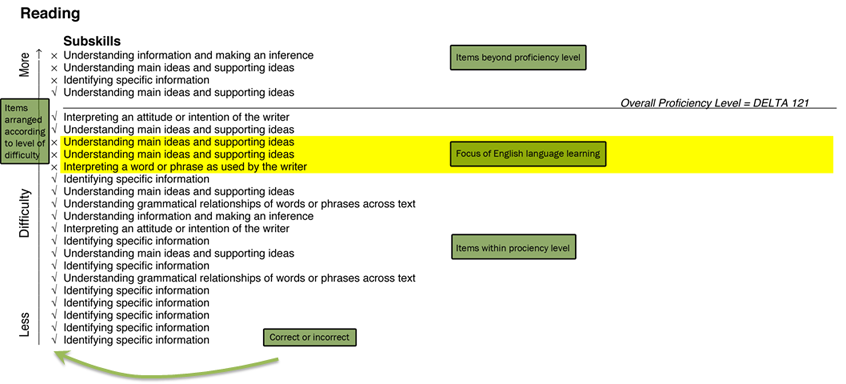
The component skills reports below show a student’s performance on each of the four tests in the DELTA. They show a description of the subskills tested in each of the questions in each of the tests that they did, in descending order of difficulty. The chart shows:
- Whether they answered the questions (test items) correctly or not.
- Overall proficiency level, as indicated by their DELTA Measure
- Subskills that a student is expected to answer correctly or incorrectly based on overall proficiency level.
- Subskills that a student should have no trouble answering but for several possible reasons, did not. These should be the focus of their English language learning

© The Hong Kong Polytechnic University 2022.
All Rights Reserved.
All Rights Reserved.